‘Flatten the Curve’ is sure to become a phrase forever linked with COVID-19. It refers to doing all we can as individuals to slow the spread of COVID-19 so that all available resources can be used for those who need them most urgently. On Friday, experts Dr. Scott Gottlieb and Dr. Paul Biddinger explained in a webinar co-hosted by WIRB-Copernicus Group (WCG) and Accumen that the rapid spread of the virus is one of the greatest threats to those at greatest risk of severe or deadly complications.
Why Does the Rate of Spread Matter?
The rate of spread – how quickly the virus is infecting new people – determines the number of patients entering the healthcare system at the same time. If the virus is spreading rapidly, many people will enter and need resources ranging from a test to time in the ICU within a very short timeframe. As with nearly anything else, if more people require attention than it is possible for those meeting the need to deliver, the system will be overwhelmed and there will not be enough capacity for everyone. In the case of COVID-19, those at lowest risk may not require any attention at all. Those at greatest risk will require extensive, specialized attention.
Dr. Biddinger of Massachusetts General Hospital (Chief, Division of Emergency Preparedness and Director, Center for Disaster Medicine) provided this assessment with the rationale for working to flatten the curve: “I don’t think it’s possible to put the Genie back in the bottle. I think we’re going to continue to see rising numbers of cases, and I think a lot of our efforts, maybe all of our efforts, are focused at blunting the epidemic curve. Keeping the peak as low as possible because that peak is where the medical demands potentially exceed capacity. The higher that peak, the more people we may see who need hospitalization, who need intensive care, who need resources like a ventilator or ECMO, which is a version of bypass to help support oxygenation. The higher the peak, the more we can’t provide these kinds of resources.”

Source: CDC, Drew Harris
Credit: Connie Hanzhang Jin/NPR
Why Limit Social Contact?
One way to slow the rate of spread and flatten the curve is to keep people apart. The idea behind social distancing is just that and social distancing is proving especially important with COVID-19 because we are seeing increasing rates of community transmission. In the case of community transmission someone will contract the virus from someone in the community – someone who did not travel or engage in anything that would expose them to the virus. The rising rate of community transmission is indicative of the fact that, “the disease is clearly spread by both asymptomatic individuals as well as by individuals before they begin to feel ill,” said Dr. Biddinger, “which is a characteristic of influenza. That makes this much more difficult – I would argue impossible – to control with public health measures [identification and isolation] directly. Once the disease is in the community, especially because of the minimally symptomatic or asymptomatic spread but also because transmission can happen before patients have symptoms, it really takes root.”
The fewer opportunities there are for people to mingle with others, the less likely it will be that new cases of COVID-19 occur.

Source: CDC, Drew Harris
Credit: Connie Hanzhang Jin/NPR
What’s Next?
One essential consideration is to keep the workforce of healthcare workers healthy and available. In our current situation, physician’s offices and Emergency Rooms are dealing with questions and concerns from a wide range of people. There are also people who need to be tested. “Our testing strategies for broad-based public testing have to be much more thoughtful. People have seen drive-through testing clinics and others that don’t bring the well and the ill together and don’t overwhelm the care system,” said Biddinger. “Those are the things we really need to look at. On the ambulatory care side, it’s important to talk about how challenging COVID-19 is.”
Up until now, testing has been limited but important. The importance has been in knowing where the virus is. As it becomes more widespread, there will be fewer instances in which a test will provide anything useful. This is especially true with young, healthy individuals. For the majority of these, COVID-19 will be the equivalent of a nasty case of the flu. They won’t require hospitalization and, since there is no treatment, will not require formalized medical care unless their symptoms worsen.
Dr. Biddinger explained that flattening the curve may mean that COVID-19 will be active for “somewhat longer” than it might have been had it spread without mitigation. The thing to remember is that we are not working to stop the virus before it’s run its course. We are working to slow the rate of transmission – to flatten the curve – so that the medical community can meet the needs of those who most urgently require that care.
Bottom Line
The validity, and urgency, of efforts to mitigate the spread of COVID-19 is not subjective: In a situation where resources – the equipment required to protect healthcare workers, provide necessities like respirators to those with the most severe cases, and ensure space in the ICU for those in dire condition – are not limitless, the only way to protect everyone effectively is to allocate those resources carefully. If we as individuals can use social distancing to slow the rate of transmission to avoid spiking the curve and overwhelming our healthcare system, we will come through this with a far greater number of good outcomes.
Want to hear this for yourself? COVID-19 Preparedness: Information from Experts, co-hosted by WIRB-Copernicus Group (WCG) and Accumen.
Other Resources:
World Health Organization (WHO) Q&A on Coronaviruses (COVID-19)
NPR – Why Staying Home Saves Lives
Published on BioSpace
The path from idea to market in the oncology sector is long and expensive. In the traditional model of drug development, therapies with the forecast of a favorable return on investment are the ones that are brought to trial. The possibility of effective therapies for the treatment of cancers like glioblastoma (GBM) is helping to bring about a new economic model. In this model, different companies will champion a drug at different stages in their development. Rather than adding to the cost of the drug, this model is designed to introduce cost-efficiencies into the cycle while bringing more drugs to market.
Kazia Therapeutics is a company focused on developing anti-cancer drugs. Headquartered in Sydney, Australia, Kazia works with oncology stakeholders worldwide to bring promising candidates through trials in the U.S. Once FDA approval is granted, these drugs are then brought to market. Kazia’s promising new cure, Paxalisib (GDC-0084), is part of the GBM AGILE trial – an international adaptive trial that will test several treatments in one study. The adaptive nature of the trial makes it easier to reduce the cost of the trial by weeding out poor performers as soon as they are identified. The number of participants in any one part of the trial will also vary, depending upon an analysis using Bayesian statistics.
Dr. James Garner, Kazia’s CEO, is optimistic about Paxalisib’s efficacy in treating GBM.
“There’s been this growing understanding that one of the big challenges with brain cancer is that none of our drugs could get to the tumor,” Garner said. “Most cancer drugs don’t go through the blood-brain barrier [the semipermeable layer that separates blood in circulation from the brain] at all. So, if the tumor in the brain is behind the blood-brain barrier, your drug doesn’t actually get there. The special thing about our drug is that it crosses the blood-brain barrier. It does it really well. We know that definitively from a lot of experimental data. Therefore, it’s one of the first drugs that can really get to the tumor.”
Garner said that “there was almost a kind of nihilism about GBM in the drug development community. This was seen as a disease where quite a few companies have tried and failed. That’s why people said, “Brain cancer. You couldn’t pick a tougher disease.”
Garner likens it to the attitude toward melanoma eight to 10 years ago. People were sure it couldn’t be fixed. Garner is encouraged by the fact that there are now about ten new drugs that have been approved for melanoma.
“The outlook for a patient with melanoma has fundamentally changed. We’ve seen the whole birth of immuno-oncology,” Garner said. “There’s no reason why brain cancer can’t follow that same trajectory.”
Paxalisib is just one of the drugs Kazia will bring to trial. Its business model is to look for drugs that don’t fit their parent companies. These drugs are among the least likely to be brought to market because they are so costly to develop for the companies that discover them.
“Most big pharma companies produce more drugs than they have the resources and the bandwidth to develop,” Garner said. “In years gone by, the ones they didn’t select to take forward would tend to sit on the shelf.”
By focusing on one type of drug – oncology – and one part of the development cycle – the path from trial-to-market – Kazia is well-positioned to contribute to significant advances in oncology treatment.
Published on BioSpace
The European Union will include one less member on February 1st. The Withdrawal Agreement Bill completed its passage through Parliament on January 22, setting January 31st as the UK’s departure date from the EU, and potentially wrapping up one part of the three-year quagmire that is Brexit. However, even with an extended transition period, it is still possible the UK could exit the EU without a deal in place.
It’s been three years since the UK held a public referendum on whether or not to remain in the European Union. Nearly seventy-five percent of eligible voters turned out for that June 2016 vote, resulting in a 52% to 48% decision to leave the EU. Nothing has come close to that level of clarity since. Delays in the exit date and disagreement about the provisions for leaving have resulted in the lack of both a clear path and a definite exit date. The uncertainty has been trying for citizens of the UK and European nations alike.
The uncertainty has also been difficult for UK biopharma. A lack of clarity on the post-Brexit parameters of such necessities as attracting and retaining talent, transporting goods, and setting prices have not only cost the industry potential contracts for work on new drugs from European countries. It has also resulted in the loss of recognition of the UK as a center of EU biopharma through the European Medicines Agency headquarters move from London to the Netherlands.
The approval of the Withdrawal Agreement in the Parliament sets January 31 as the date for the UK to leave the EU. However, all rules, regulations, tariffs, taxes, etc. in place with the EU will remain in place through the end of 2020. Agreements on each and every detail of doing business with the EU while not a member nation must be reached before 2021. Once again, the future remains uncertain and the biopharma industry finds itself in the same unsettled state as before Thursday’s vote.
Attention now shifts to the process of working out deals on the myriad aspects of trade between the UK and EU by mid-2020 in order to give EU member nations time to debate the proposed terms on the agreements necessary for a smooth transition. Meetings are said to begin in February, leaving months to accomplish this essential work. With little time to get deals in all areas, some are calling for agreements to be reached by sector. Others are looking at a worst-case wherein agreements in key areas such as security and transfer of goods are at least in hand.
If no agreements are reached by the end of 2020, the nagging constant No-Deal Brexit could be the result. Neither the EU nor the UK wanted to Brexit to occur without a plan in place. For 2020 to end without a plan in place will mean UK will be left to trade with EU member nations on the same footing as any other non-member. They also could be left without the ability to attract and retain the talent they require for their research. Potential troubles with security, and the likelihood of jammed channel crossings, constitute additional areas of concern for UK pharma.
The biopharma industry has a lot at stake. A spokesperson from the Bioindustry Association said, “It is clear that 2020 will be the year when the UK begins to shape a new way of engaging in global trade. The agreements to be negotiated will form the basis of the operating environment for years to come and it’s crucial we get deals that enable our life sciences sector to thrive.”
Paradoxically, even with the January 31st exit date and an end to all agreements with the EU set for the end of 2020, a No-Deal Brexit may be likelier than ever.
Published on: BioSpace
If you live in the US, it’s likely you’ll eat a meal that includes food that was inspected by the USDA when you sit down to dinner tonight. Some of the food on your plate may be certified organic. Some may have had its genome sequenced and been tracked from field to market. The involvement of these entities alone makes for a crowded table, but you’ll need to make room for quite a few more.
Those responsible for NASA’s Moderate Resolution Imaging Spectroradiometer (MODIS) instruments aboard the Aqua and Terra satellites will need a place. The statisticians at the USDA’s National Agricultural Statistics Service (NASS) Spatial Analysis Research Section who use the MODIS data from those instruments will also join you. And don’t forget the scientists at NOAA and the National Drought Mitigation Center (NDMC) who work with data generated by the Aqua and Terra satellites. You’ll need a few seats for them, too.
Over the past decades, technology has reached aspects of our lives ranging from communication to medicine, entertainment to manufacturing. It’s of little surprise that tech has reached the food on your table in a big way during this past decade. In addition to the use of whole-genome sequencing (WGS) by the FDA to nip foodborne illness outbreaks in the bud, the FDA and NASA are adding another layer of oversight. Through NASS, they are combining satellite surveillance with statistical analysis to increase crop yields and better serve the interests of agriculture – and by extension, you as the consumer at the dinner table. The information available to farmers and those overseeing food-related government programs is used to increase crop yields and inform crop rotation schedules. It also makes it more likely that you will have a steady source of food for your plate.
Satellite Imagery to the Food on Your Plate
One way that farmers can improve their fortunes is by knowing how much competition they face before they plant a specific crop like potatoes. The USDA makes it possible for farmers and other stakeholders in agriculture, to see what is being grown across the country and in their region. The CropScape – Cropland Data Layer (CDL) data is available at no charge through the use of the CropScape NASS data portal. Those visiting the site can focus on regions and areas of greatest interest to them. Companies that market their products to farmers can also access this data through the portal, providing them with information about what types of products will be in demand during the growing season. Any of these parties can view layers on the map that show the different types of crops.
In addition to the images from MODIS, the information for the layers in the CropScape system comes from agricultural advisors, inspectors, and farmers who upload their data to the system. Because they have worked to identify the crops grown in each field and coders have worked to link the data from those reports to the pixel level on the map, an accurate and timely view of crops across the country is available. Historical data is also available to provide insight into which crops have done well in which regions in prior years.
By using algorithms designed to interpret the red, near-infrared and shortwave infrared of satellites capturing images from the land, the CropScape map can not only differentiate by crop, but also by the stage of crop development. The ability to use this technology to see what is growing successfully and what is not, on a national level, provides farmers with the information they require when deciding what to plant. The bottom line for consumers is a steady supply of produce, either in the form of what was expected in the market, like carrots, or an alternative crop.
For the farmer, this LandSat (Earth-observing) technology, also impacts routine decisions related to harvesting their crops. From the images, it is possible to view a specific area, such as a cranberry bog, to see something as small but significant as the peak harvest time for the cranberries in that bog. The use of this free source translates into valuable, actionable knowledge about when to gather that portion of his crop. It saves guesswork and time, allowing them to plan for the best use of resources related to bringing the crop to market.
Recognizing Drought Before it’s Too Late
Some weather events, like torrential rains or hurricanes, are obviously damaging to crop yields. When one of these hits an area, the effect on crops is immediate. With flooding, seedlings don’t root and more mature crops suffer greatly. The weather and winds from hurricanes do significant damage to crops, silos, and equipment. Accurate forecasts can help farmers delay planting if severe weather is on the way, but once the crops are in and growing, preventive measures can only do so much.
Severe drought is equally damaging. In severe conditions, crops suffer and yields decline, causing shortages at the market along with higher prices. Unlike rainfall or the atmospheric weather conditions that cause hurricanes, droughts are the result of several factors on the ground in addition to the lack of precipitation. There is another type of drought that is every bit as damaging to crop yields. These “Flash Droughts” can damage crops in a matter of weeks.
Farmers needed a method for detecting flash drought conditions before it was too late to save the crop. NOAA took the lead in the development of the Evaporative Stress Index (ESI). This index gives farmers access to data, at no cost, about the state of moisture in their area. Farmers and other stakeholders can not only view drought information on a national map, but they can also input coordinates and see what the estimates are for conditions in their specific area. The index assesses conditions without precipitation, providing a look at how crops are doing with the irrigation provided by the farmer. For farmers, this information can be used to ensure they have a successful season. For you, it’s a matter of ensuring that the agricultural sector is able to meet consumer needs.
The next time you sit down to dinner, the meal you eat will have been brought to you through the efforts of NASA, NASS, the USDA, NOAA, and the FDA, along with teams of farmers, scientists, analysts, and engineers.
What is the Landsat satellite program and why is it important?
National Drought Mitigation Center
USDA Estimation of Crop Production
Published on The Spoon
H.R. 3, the Elijah E. Cummings Lower Drug Costs Now Act (cited as the Lower Drug Costs Now Act of 2019), awaits a vote by the House in December. The bill has a number of provisions that are intended to make prescription drugs more affordable for those in the Medicare program. A key provision is that it will require the Centers for Medicare and Medicaid Services (CMS) to negotiate prices for some drugs. This is a change from current law, which prohibits the CMS from negotiating the price it pays for drugs. The ability to negotiate prices, combined with the use of the average price paid for that drug in specified countries, along with a top price point of 120% of the reference average list price, is at the heart of the bill.
Under the bill, the maximum price to be paid for any drug will be set through an international comparison of the market price paid for brand name drugs in specified industrialized countries. CMS will negotiate a price that is no more than 120% of that average price. Insulin products are specifically mentioned as among those that CMS must negotiate.
A Painful Pill to Swallow: U.S. vs. International Prescription Drug Prices (the report) prepared by Ways and Means Committee Staff in September 2019 provides the prices used for comparison here. The insulin products included in that report are name brands and will allow us to determine just how much can be saved with a move to an indexed pricing strategy like that proposed in the Lower Drug Costs Now Act of 2019.
Deciding the Average Price
The manufacturer (list) price will be used to calculate the average paid for a drug in six industrialized nations. Currently, those six countries are Australia, Canada, France, Germany, Japan, and the UK. Some refer to these six countries as an Index for the price of a drug. In Europe and elsewhere, drug prices are often set through the use of external reference pricing (ERP).
With ERP, the ex-factory (list) price in a set sample of countries that varies according to the country using that particular ERP is used as a benchmark or basket of prices paid. These prices provide the basis for the negotiation of the price to be paid in the country using the benchmark.
Insulin Pricing in the U.S.
The price paid for insulin products are cited in H.R. 3 as being prices that the CMS must negotiate. The cost of insulin products in the U.S. is currently a matter of great concern. There is widespread news coverage and anecdotal evidence showing that insulin prices are at an all-time high and rising. The report quotes the Centers for Disease Control and Prevention (CDC) as reporting, “… the price of insulin increased by 197 percent from 2002 to 2013. Total Medicare Part D spending on insulin increased by 840 percent from $1.4 billion to $13.3 billion between 2007 and 2017.” A survey of news outlets indicates that, despite differences in the rate price increases of pens versus vials, these trends continue today.
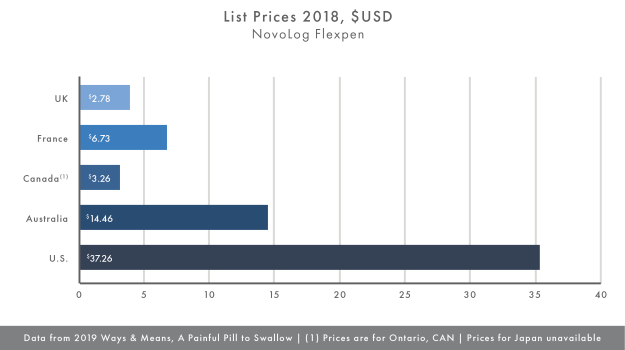
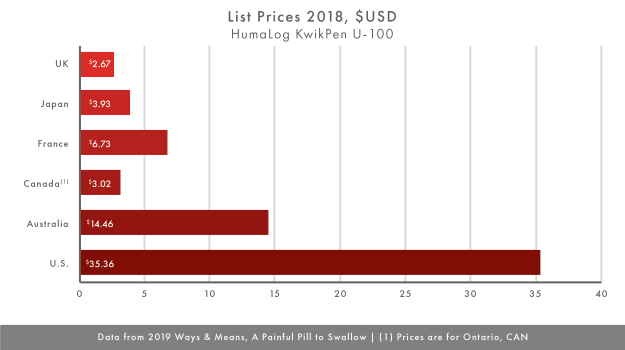
Making use of the data in the report, the average price of Humalog KwikPen U-100 and the NovoLog Flexpen in the reference countries and the U.S. for comparison, Charts I and II show that that the difference in price between the U.S. and other countries is significant. The list price for these insulin products that is closest to the U.S. list price is the price in Australia. With U.S. list prices for the Humalog KwikPen U-100 and the NovoLog Flexpen at $35.36 and $37.26, respectively compared to the Australian list prices of $14.46 for each, the U.S. prices are more than twice as much. When compared to list prices in Ontario, list prices in the U.S. are nearly 12 times as much.
Taking the average list price in the countries in our small sample results in a reference list price for the Humalog KwikPen U-100 of $6.13 and the NovoLog Flexpen of $6.16. Even if CMS used the provision in the H.R. 3 to negotiate a price for these insulin products at 120% of the average, the price in the U.S. would still be six times the average for each product. However, this would represent substantial savings over the current list prices for these products.
What Does it Mean
Clearly, prices in the U.S. exceed those in comparable countries by a wide margin. Even at the slimmest point, list prices in the U.S. are more than twice the other list prices. The claim that pharmaceutical companies report sales their products at a profit in the countries that would be used as reference points, leaves a disturbing disparity in the prices in the U.S. Assuming there are no other variables at work that cause the list prices in the U.S. to carry such a premium while prices in other countries are so much lower, the difference that remains is the vehicle for pricing the drugs. Using reference prices has resulted in lower drug prices around the world. Allowing CMS to negotiate the prices of drugs, within the guidelines of the bill, could effectively make the disparity in list prices for insulin products a thing of the past.
More in our series on H.R. 3, the Elijah E. Cummings Lower Drug Costs Now Act (cited as the Lower Drug Costs Now Act of 2019):
What are the Drugs Most Likely to Remain Undeveloped?
Part IV of our series on the Lower Drug Costs Now Act of 2019 will focus on the drugs least likely to make “the cut” if The Editorial Board of The New York Times is correct in their assessment of economics of the bill.
What are the Alternatives?
In Part V we’ll explore some of the alternatives to the Lower Drug Costs New Act.
The Fate of H.R. 3
The final article in our series will describe the path the bill followed to victory or defeat in the House, including attempts to alter the bill before the vote and the outcome of the vote.
You can also catch up on our series by reading Part I and Part II.
Published on BioSpace
As a December vote in the House on H.R. 3, the Elijah E. Cummings Lower Drug Costs Now Act (cited as the Lower Drug Costs Now Act of 2019) looms, there’s a great deal of interest from Medicare Part D enrollees and others affected by lower drug costs.
Just what do those in favor of the H.R. 3 – organizations, individuals, companies and institutions – have to say?
Here’s a sample
- AARP favors passage of H.R. 3 as one part of their Stop Rx Greed campaign. AARP quotes Ways and Means Chairman Richard Neal in a Nov 7 article on their site by Dena Bunis, AARP: “Patients in the United States, on average, pay four times as much as consumers in similar countries for the same prescriptions. All the while, drug companies continue to bring in tremendous profits. This is outrageous.”
In that same piece, Bunis writes, “House members critical of the legislation said it would inhibit research and development for new cures and medications, something supporters dispute. Mark Miller, a former executive director of the board that advises Medicare on policy issues, told Ways and Means members at last week’s hearing that pharmaceutical companies spend much more on marketing and other costs than on R&D and that they would still be profitable even if this measure were enacted.”
Nancy LeaMond, AARP executive president and chief advocacy and engagement officer urged the House to pass the legislation, which includes a cap on out-of-pocket prescription costs for Medicare Part D enrollees. She wrote, “There is no reason Americans should be paying the highest drug prices in the world.”
- American Hospital Association, on September 19, wrote of the benefit to patients who must choose between prescriptions and other expenses, “Outrageous drug prices force too many patients into rationing their drugs or leaving their prescriptions unfilled.” As such, they applaud the Lower Drug Costs Now Act. The reality of patient’s unable to afford their medication is made real to those working in hospitals and the healthcare system because they “… see the consequences first hand: patients coming back through our doors sicker than when they left.”
- Patients for Affordable Drugs (P4AD) writes, “The prescription drug pricing system in the U.S. is rigged against patients.” In Finding Solutions they write, “We have to break the monopoly pricing power of the drug corporations and demand transparency from pharmacy benefit managers who run drug insurance programs.” A key factor in this is the ability of Medicare to negotiate lower costs for patients. “Right now Medicare has to accept the price dictated by the drug company. Medicare can’t say no—no matter the cost.”
As part of a call for greater transparency in the pharmaceutical industry, P4AD calls for drug corporations to disclose the way they set prices. Specifically, how much is for R&D, marketing and advertising, and manufacturing and distribution. They also call for drugs that are funded by taxpayers in the form of funding for the NIH prior to patents are taken on the drugs, to benefit the taxpayers that funded those drugs.
- Henry A. Waxman – Chairman of Waxman Strategies, a public interest focused policy and public relations firm. Former U.S. representative for California’s 33rd district – as published in Health Affairs Blog. In his post, Lower Drug Costs Now, Waxman writes, “…The fact that we [Americans] spend twice as much on health care as the average for wealthy industrialized countries while having the lowest life expectancy and the highest infant mortality rates is a national disgrace.” He points out that in the period from July 2018 to July 2019, there was a 17% increase in the list price for more than 3,400 drugs. Especially disturbing? Even after taking a number of factors into account from 2012 to 2015, insulin costs per patient nearly doubled.
Waxman continues, “Why do these appalling price disparities exist? The primary reason is that every other industrialized country negotiates drug prices with the pharmaceutical industry, using their purchasing power to save taxpayer and consumer dollars. The drug companies, by their own admission, still earn profits in these countries – just not exorbitant windfalls.”
- The Editorial Board of The New York Times, comprised of opinion journalists, separate from the newsroom with views informed by expertise, research, debate and certain longstanding values,” published an Opinion piece titled The American Way of Paying for Drugs Isn’t Working on Nov 2. They wrote, “Under a new bill [HR 3], a handful of new drugs might never get produced. That would be worth it.”
In the enumeration of the proposed changes and potential risks under the new bill they write, “The pharmaceutical industry could lose as much as $1 trillion in profits over a decade, and as a result would bring roughly eight to 15 fewer drugs to market during that time period (out of the 300 or so that would be expected), the Congressional Budget office estimates. To understand why that’s a fair and worthwhile trade-off, it’s important to understand how the current system works.
After describing the workings of the U.S. and foreign drug development approaches, they conclude that, “Support for the same ideas [the government to negotiate directly with drugmakers and for the results of these negotiations to apply to private insurance as well as to Medicare] shrank when respondents were told that research and development would be imperiled as a result of these changes. That reluctance is not surprising, given the fearmongering that the pharmaceutical industry and its supporters in Congress have engaged in over this issue.”
What is the Basis for the Claims Made?
Just how much can be saved with a move to an indexed pricing strategy? The Ways and Means Committee Staff prepared a report on that very topic in September 2019. A Painful Pill to Swallow: U.S. vs. International Prescription Drug Prices describes the state of drug prices in the U.S. versus the rest of the world. Part III of our series will present those findings.
What are the Drugs Most Likely to Remain Undeveloped?
Part IV of our series on the Lower Drug Costs Now Act of 2019 will focus on the drugs least likely to make “the cut” if The Editorial Board of The New York Times is correct in their assessment of economics of the bill.
What are the Alternatives?
In Part V we’ll explore some of the alternatives to the Lower Drug Costs New Act.
The Fate of H.R. 3
The final article in our series will describe the path the bill followed to victory or defeat in the House, including attempts to alter the bill before the vote and the outcome of the vote.
Published on BioSpace